When looking at the ZiZo graph on the Dashboard, you'll notice the right side of the graph indicates an Expectation value. (see below)
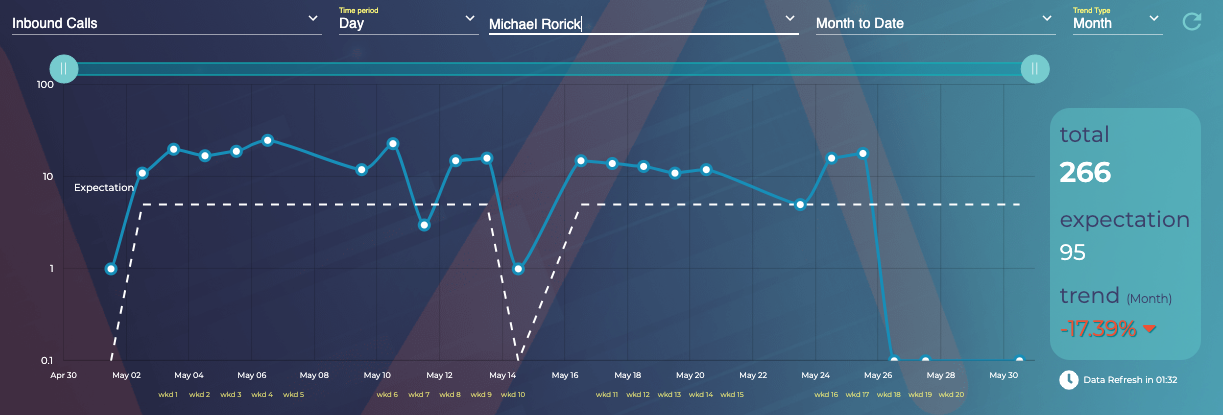
In this graph the KPI is answering InBound Calls. It is set under my own name as an agent and it is reflecting a Month to Date view. The graph is indicating that I have an expectation of 95 InBound calls within this period of time and it's also showing that I have received a total of 266 in that same period. (Not Bad!)
When I change the time selection to "Last Week", notice that the total and the Expectation change due to it being a smaller selected amount of time.
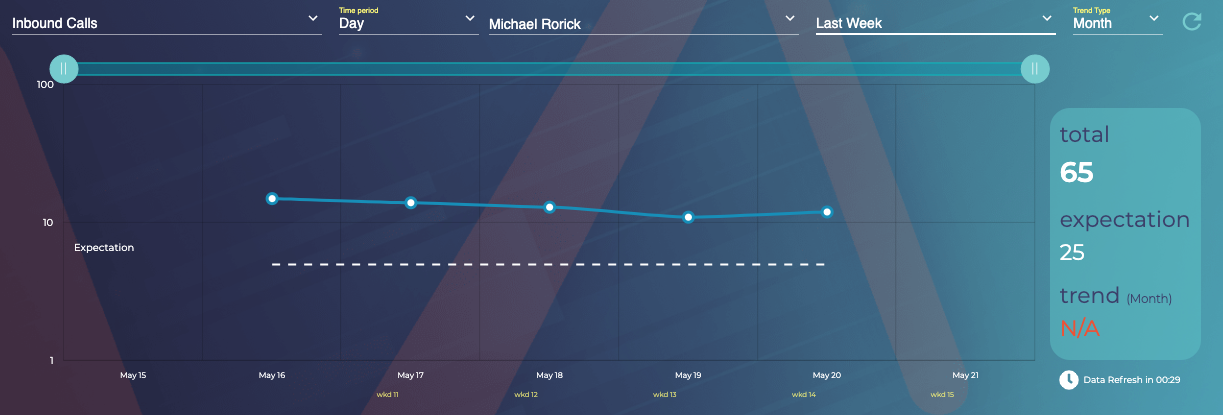
The Expectation is 25 for the time selected and last week I received a total of 65 InBound Calls.
The Expectation will change as an agent advances higher in Rank and Level. This will either make it more difficult to reach the KPI or establish more productivity with higher levels of skill.
At this pace, I am certain to make bonus! ;) It's Game Time!