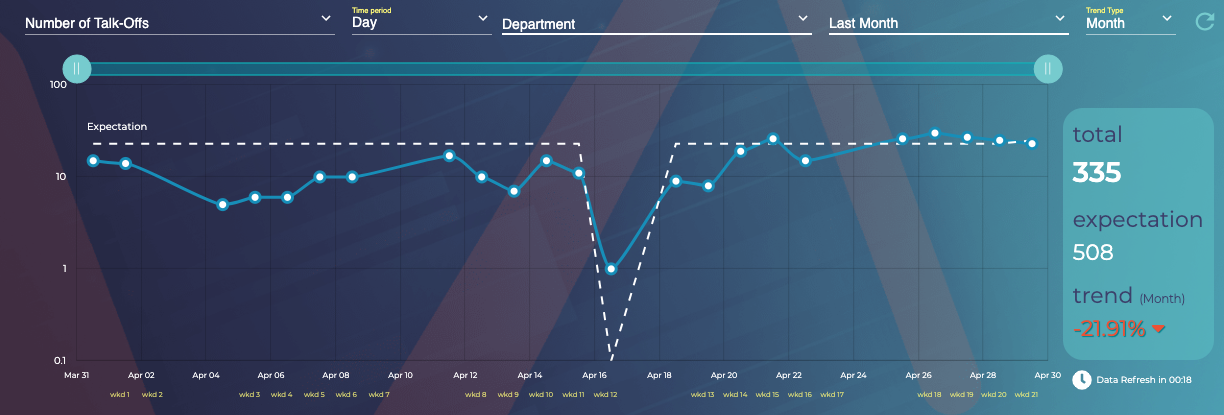
When looking at the ZiZo performance graph on the Dashboard page, you'll notice a series of dashed lines running through the graph. (See below) These lines represent the KPI expectation level of the department (manager view) or the KPI expectation of the agent (manager/agent view).
In a department view the KPI expectation is the expected sum total for all agents within the department for a particular KPI. If you change the KPI in the performance graph,. the expectation level changes accordingly.
When changing from a department view to the view of a particular agent, the KPI expectation for that agent will be represented in the dashed line as well.
This gives an easy way to view the productivity of the agent or department is compared to their expected value.
When dashed levels drop down to "zero", that typically represents that a payment or other KPI has been processed or documented on a non-scheduled work day.